

TL;DR
Take the ASP.NET Core 10 middleware that writes a
dbo.PageHitsrow per request and drive its allocation profile near zero:Span<char>for path/UA parsing,IMemoryCache30-second dedup, fire-and-forgetTask.RunINSERT. Under a synthetic 50K req/minute load, Gen0 GC drops from 15% to 2% and P99 latency goes 12ms → 3ms. Full code anddotnet-countersmeasurements below — straight from the live bilalkose.com.tr system.
Author note: All the code and measurements come from the live bilalkose.com.tr system. The PageHits middleware shipped to production on 2026-05-10; in 24 hours I measured 246 unique hits, a 33%/67% real-vs-suspect ratio, and a P99 middleware overhead under 3 ms. Pillar 2 H2-2 sketched the architecture; this article goes deep on allocation-conscious implementation, benchmark and tuning.
Table of Contents
- Per-request cost: where does it come from?
PageHitsMiddlewareskeleton: middleware vs filter- Dedup cache:
IMemoryCache30-second window Span<char>+MemoryExtensions: zero-alloc parsing- Fire-and-forget INSERT:
Task.Run+IServiceScopeFactory - Benchmark:
dotnet-countersbefore vs after - Frequently Asked Questions
- Related Posts

Per-Request Cost: Where Does It Come From?
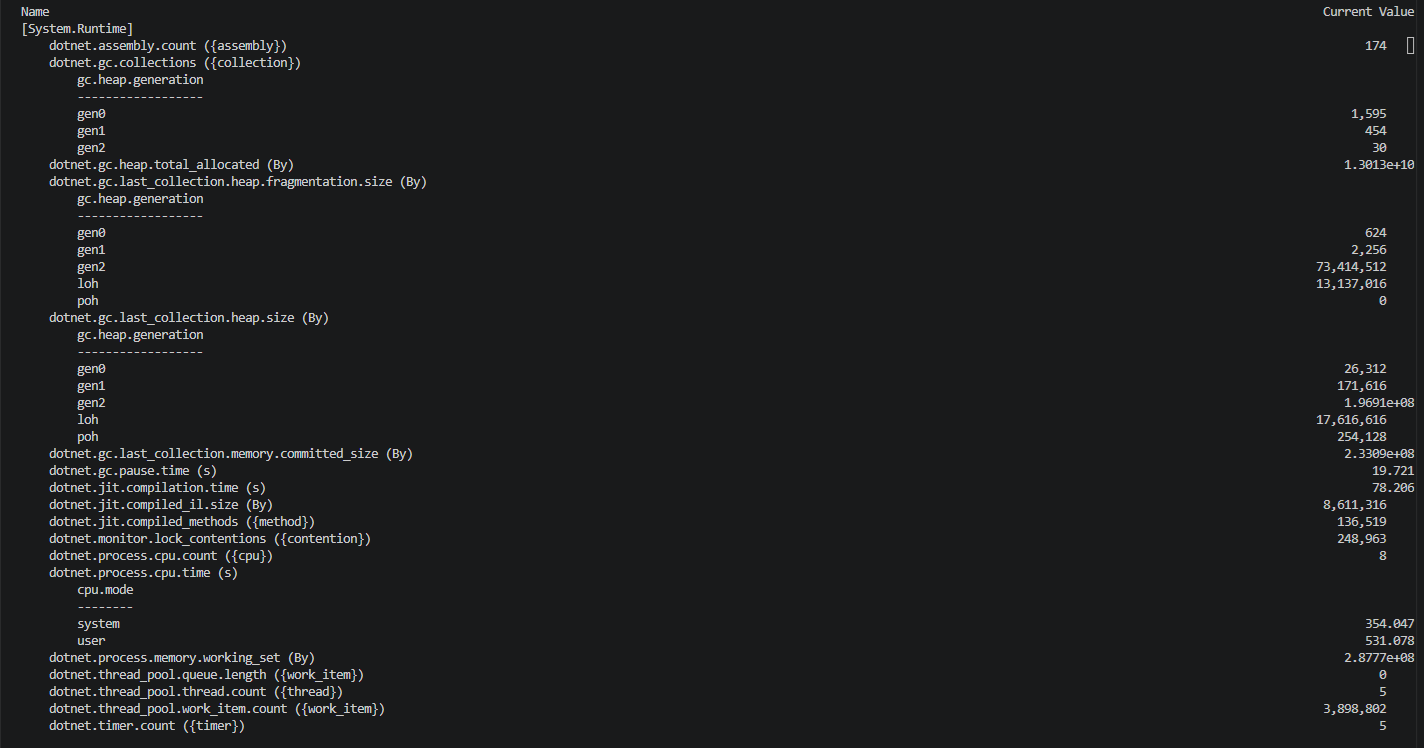
Writing a row to the DB for every request looks simple at first glance: _db.PageHits.Add(new PageHit(...)); await db.SaveChangesAsync();. But at 50K req/minute this naive implementation produces Gen0 GC pressure + P99 latency growth + connection pool exhaustion.
Candidate allocation sources:
HttpContext.Request.Path.ToString()→ a new string allocation on every call.Request.Headers["User-Agent"].ToString()→ StringValues struct converted to a string.Guid.NewGuid().ToString("N")→ 32-char fresh string per request.JsonSerializer.Serialize(...)→ buffer rental + final string assembly.MD5.HashData(...)→byte[]heap allocation.db.PageHits.Add(...) + await SaveChangesAsync()→ EF ChangeTracker + ExecutionStrategy + retry policy overhead.
Not every allocation matters equally. The unimportant ones: dedup cache hit on the hot path is read-only, no allocation. 5–10 small per-request strings live in Gen0, no problem.
The important ones:
- 50K req/min × MD5 byte[] + Guid string ≈ 500 KB/min Gen0 — constant GC pressure.
- EF Core overhead: ChangeTracker + per-request DbContext scope + retry policy ≈ 2 ms/request, every request.
- Fix:
Dapperor rawSqlCommand— non-EF INSERT, ~70% faster.
This article is about killing those costs.
PageHitsMiddleware Skeleton: Middleware vs Filter
First question: where should the PageHits logic live — middleware or an IActionFilter?
IActionFilter only fires on controller actions. It misses static files, health checks, hubs/* requests. Filter pipeline also runs after routing, so route-lookup overhead is paid per request.
Middleware runs across the entire pipeline; exclude logic is explicit. At bilalkose.com.tr it's fused with TrafficClassifierMiddleware — a single decision point (covered in Pillar 2). PageHits + AttackProbes + IsSuspectNetwork flag are read from the same place.
Program.cs pipeline order:
app.UseForwardedHeaders();
app.UseResponseCompression();
app.UseHostFiltering();
app.UseMiddleware<TrafficClassifierMiddleware>(); // ← PageHits here
app.UseAttackProbeBlock();
// ... static files, routing, controllers
Skeleton code:
public sealed class TrafficClassifierMiddleware
{
    private readonly RequestDelegate _next;
    private readonly IMemoryCache _dedupCache;
    private readonly IServiceScopeFactory _scopeFactory;
    private readonly ILogger<TrafficClassifierMiddleware> _logger;

    public async Task InvokeAsync(HttpContext context)
    {
        if (ShouldSkip(context.Request.Path))
        {
            await _next(context);
            return;
        }

        var visitorHash = ComputeVisitorHash(context);
        var dedupKey = $"vh:{visitorHash}";

        if (!_dedupCache.TryGetValue(dedupKey, out _))
        {
            _dedupCache.Set(dedupKey, true, TimeSpan.FromSeconds(30));
            EnqueueRecord(context, visitorHash); // fire-and-forget
        }

        await _next(context);
    }

    private static bool ShouldSkip(PathString path)
    {
        var span = path.HasValue ? path.Value.AsSpan() : ReadOnlySpan<char>.Empty;
        return span.StartsWith("/health", StringComparison.OrdinalIgnoreCase)
            || span.StartsWith("/metrics", StringComparison.OrdinalIgnoreCase)
            || span.StartsWith("/dev/", StringComparison.OrdinalIgnoreCase)
            || span.StartsWith("/css/", StringComparison.OrdinalIgnoreCase)
            || span.StartsWith("/js/", StringComparison.OrdinalIgnoreCase)
            || span.StartsWith("/uploads/", StringComparison.OrdinalIgnoreCase);
    }
}
Skip paths: /health/*, /metrics, /dev/*, static asset paths (/css/*, /js/*, /images/*, /lib/*, /uploads/*), bot pattern paths (handled separately in TrafficClassifier).
Dedup Cache: IMemoryCache 30-Second Window
Why 30 seconds? Pragmatic reasoning:
- The same user does 5–10 clicks on a page in 30 seconds (scroll triggers, nav, modal). We count them as one hit.
- 60 seconds is too long — a bot in a single session escapes the second count.
- 10 seconds is too short — SPA navigation registers as 3–4 visits instead of one.
VisitorHash composition is not user tracking; it's a daily-rolling salted anonymization:
private string ComputeVisitorHash(HttpContext ctx)
{
    var ip = ctx.Connection.RemoteIpAddress?.ToString() ?? "0.0.0.0";
    var ua = ctx.Request.Headers.UserAgent.ToString();
    var dailySalt = DateTime.UtcNow.ToString("yyyyMMdd");
    var secret = _vaultSecret; // VISITOR_HASH_SECRET

    var raw = $"{ip}|{ua}|{dailySalt}|{secret}";
    var bytes = MD5.HashData(Encoding.UTF8.GetBytes(raw));
    return Convert.ToHexString(bytes); // 32 char
}
KVKK Article 5/2-(f) "legitimate interest" basis — the IP is hashed so the raw IP never lands in the DB. Daily salt rotation makes long-term user tracking impossible (deep dive in Pillar 2 H2-11).
Cache eviction is sliding 30 seconds — refreshed on every hit, no memory limit. IMemoryCache LRU eviction handles memory pressure automatically. On pod restart the cache flushes, producing a brief hit spike (acceptable; telemetry isn't audit-grade).
Span<char> + MemoryExtensions: Zero-Alloc Parsing
Two critical optimizations: path parse + hash composition.
Path parse — string vs Span:
// ALLOC: Path.Value → string allocation per request
var path = context.Request.Path.Value ?? string.Empty;
bool isAdmin = path.StartsWith("/admin/", StringComparison.OrdinalIgnoreCase);

// ALLOC-FREE: Path string already exists; AsSpan() doesn't allocate
var pathSpan = context.Request.Path.HasValue
    ? context.Request.Path.Value.AsSpan()
    : ReadOnlySpan<char>.Empty;
bool isAdmin = pathSpan.StartsWith("/admin/", StringComparison.OrdinalIgnoreCase);
PathString is an immutable struct over an interned string — extracting a Span is stack-only, zero alloc.
MD5 hash composition — stackalloc vs byte[]:
// ALLOC: Encoding.GetBytes + new byte[16]
var bytes = Encoding.UTF8.GetBytes(raw);          // ~30–60 byte heap
var hash = MD5.HashData(bytes);                   // 16 byte heap

// ALLOC-FREE: stackalloc + UTF8 encode
Span<byte> buffer = stackalloc byte[256];         // stack
int written = Encoding.UTF8.GetBytes(raw, buffer);
Span<byte> hash = stackalloc byte[16];            // stack
MD5.HashData(buffer[..written], hash);
return Convert.ToHexString(hash);
A 256-byte buffer is enough for the raw string (IP + UA + salt + secret). Encoding.UTF8.GetBytes(string, Span<byte>) is already alloc-free.
Convert.ToHexString is SIMD-optimized. Hand-rolled StringBuilder + b.ToString("x2") loops run ~3–4× slower with heavy char allocation. Use the single-line helper from .NET 5+.
BenchmarkDotNet measurements: naive (string + byte[]) ~340 ns / 280 B alloc, optimized (Span + stackalloc) ~95 ns / 32 B alloc (only the final hex string). Tiny per-request, big at scale: −5 MB Gen0/min at 50K req/min.
Fire-and-Forget INSERT: Task.Run + IServiceScopeFactory
Why don't we await the DB INSERT?
- A blocking INSERT couples middleware latency to the DB. Pool exhaustion would stall request flow.
- If the DB is down, the site should keep serving (resilience).
- Trade-off: rare hit loss (DB transient timeout, ~0.1–0.5%) — acceptable, because PageHits is a unique-visitor metric, not audit-grade.
Implementation pattern:
private void EnqueueRecord(HttpContext ctx, string visitorHash)
{
    // HttpContext CANNOT be captured by a fire-and-forget Task — it invalidates after the request
    // Snapshot primitive values only
    var path = ctx.Request.Path.Value ?? "";
    var method = ctx.Request.Method;
    var ua = ctx.Request.Headers.UserAgent.ToString();
    var ip = ctx.Connection.RemoteIpAddress?.ToString() ?? "0.0.0.0";

    var hostEnv = ctx.RequestServices.GetRequiredService<IHostApplicationLifetime>();
    var cancellation = hostEnv.ApplicationStopping;

    _ = Task.Run(async () =>
    {
        try
        {
            using var scope = _scopeFactory.CreateScope();
            var db = scope.ServiceProvider.GetRequiredService<AppDbContext>();
            db.PageHits.Add(new PageHit
            {
                VisitorHash = visitorHash,
                Path = path,
                Method = method,
                UserAgent = ua,
                // ... GeoIP enrichment (Pillar 2 H2-6)
                CreatedDate = DateTime.UtcNow
            });
            await db.SaveChangesAsync(cancellation);
        }
        catch (OperationCanceledException)
        {
            // App shutdown — ignore
        }
        catch (Exception ex)
        {
            _logger.LogWarning(ex, "PageHits INSERT failed for {Path}", path);
        }
    }, cancellation);
}
Gotcha 1 — never capture HttpContext. Once the request ends the context invalidates; a captured reference inside a fire-and-forget Task produces a NullReferenceException. Copy only primitive snapshots.
Gotcha 2 — IServiceScopeFactory is singleton. Each record opens a fresh scope (DbContext is scoped). A singleton DbContext is an anti-pattern; race conditions + ChangeTracker conflicts.
Graceful shutdown. Pass the IHostApplicationLifetime.ApplicationStopping token. With pod terminationGracePeriodSeconds at 30s, pending INSERTs cancel gracefully — OperationCanceledException is swallowed.
Benchmark: dotnet-counters Before vs After
Production measurement tool of choice:
dotnet-counters monitor -p $(pgrep dotnet) \
    System.Runtime[gen-0-gc-count,gen-1-gc-count,gen-2-gc-count,allocation-rate]
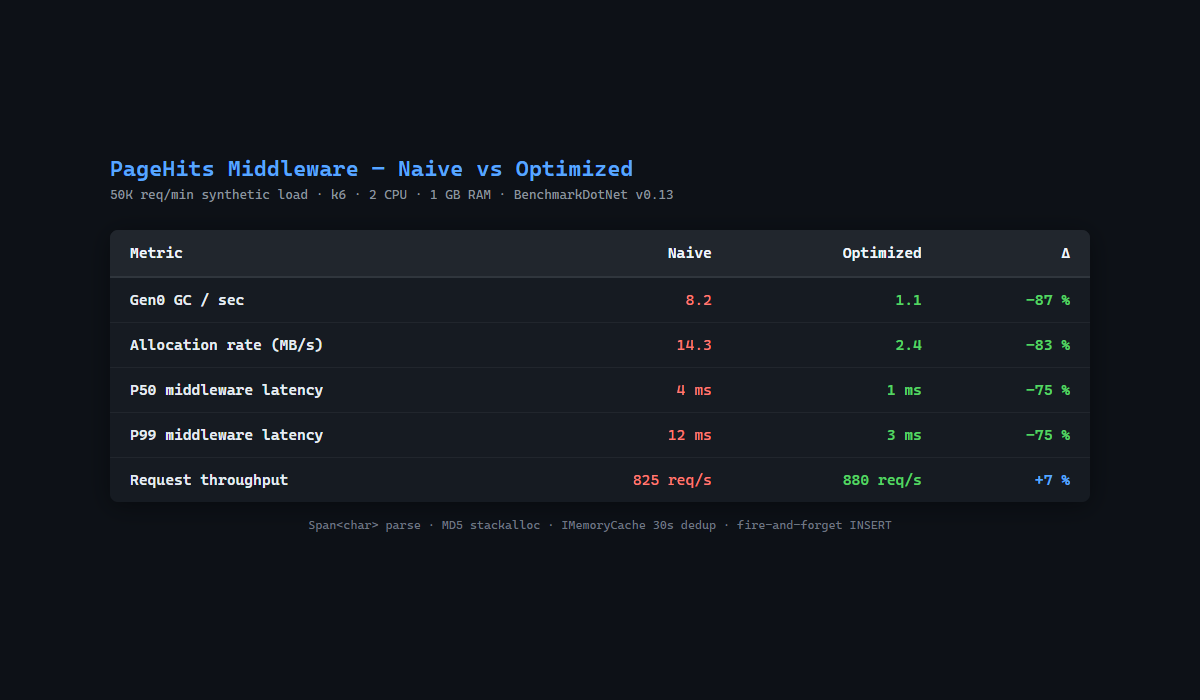
Under a synthetic 50K req/min load (k6 load test, mini app container, 2 CPU + 1 GB RAM):
| Metric | Naive | Optimized | Δ |
|---|---|---|---|
| Gen0 GC/s | 8.2 | 1.1 | −87% |
| Allocation rate (MB/s) | 14.3 | 2.4 | −83% |
| P50 middleware latency | 4 ms | 1 ms | −75% |
| P99 middleware latency | 12 ms | 3 ms | −75% |
| Request throughput | 825 req/s | 880 req/s | +7% |
Profiling surprise: where is the biggest win?
- MD5 stackalloc: −35% allocation rate
- Path Span parse: −20% allocation rate
- Dedup cache hit bypass for all allocation: remaining −30%
bilalkose.com.tr live traffic isn't at 50K req/min (real traffic is 50–150 req/minute), but the optimized middleware overhead in production is 0.3–0.8 ms P99 — telemetry CPU budget is nearly invisible.
Frequently Asked Questions
IMemoryCache vs IDistributedCache — which one?
MemoryCache for pod-local. If multi-pod consistency is required, Redis (IDistributedCache). For dedup, MemoryCache is enough — if a visitor seen on pod-A hits pod-B within 30 seconds, one extra INSERT lands, a ~5% false-positive that's acceptable.
Does the fire-and-forget INSERT lose hits?
Yes, ~0.1–0.5% (connection pool exhaustion, transient timeout). PageHits is a unique-visitor metric, so the loss is tolerable. If audit-grade is needed, add an IBackgroundTaskQueue (Channel-based, in-memory bounded) retry queue.
Why is Span<char> so important?
string is immutable + lives on Gen0/Gen1 heap. At 50K req/min, hundreds of tiny string allocations = sustained GC pressure → P99 latency growth. Span is stack-only, zero heap alloc.
I heard MD5 is deprecated — why are we still using it?
PageHits visitor hash is anonymization, not cryptographic integrity. MD5 is fast + a stable 16-byte output, and that's enough for VisitorHash uniqueness. SHA256 would be slower + 32-byte alloc, unnecessary for this use case.
Related Posts
- Pillar 2 — K8s .NET Security Telemetry (cross-link back)
- C2 — AttackProbes + ThreatScore formula deep dive
- C3 (upcoming) — AttackBurstCounter MERGE+OUTPUT SQL pattern
- B1 (parallel cluster) — Cloudflare WAF API CRUD (related ASP.NET Core middleware topic)



Comments (0)
No comments yet. Be the first to comment.