

TL;DR
If your analytics dashboard shows 100 visitors a day, your real human count is roughly 33. The remaining 67% is datacenter, VPN and null ASN traffic. I'm running a live production system that separates bot from human using PageHits + AttackProbes + IsSuspectNetwork, auto-blocks via a MERGE+OUTPUT sliding-window burst counter, and stores it all with a KVKK-compliant PII-free design for 90 days. Full SQL schema, code and real 24-hour production measurements below.
Author note: All SQL schemas, code and metrics in this article come from the live bilalkose.com.tr system. The PageHits + AttackProbes tables went to production on 2026-05-10; within 24 hours we measured the 33%/67% ratio, 157 attack probes and 246 backfill telemetry rows. The Sub-Faz A++/A+++ design decisions (datacenter ASN registry, IsSuspectNetwork flag, MERGE+OUTPUT AttackBurstCounter pattern) come directly from production experience.
Table of Contents
- What is Security Telemetry and Why Origin-Side?
- PageHits Middleware Architecture
- AttackProbes + the ThreatScore Formula
- AttackBurstCounter: MERGE+OUTPUT Sliding Window
- IsSuspectNetwork Flag: Datacenter / VPN / Null ASN
- MaxMind GeoIP Singleton Reader Pattern
- Log → AttackProbes Backfill ETL
- Origin Block Loop: TrafficClassifier → IpBlocklist → CF List
- Real Visitor Admin Dashboard
- Prometheus Metric Export
- Privacy + KVKK: PII-Free Telemetry Design
- Frequently Asked Questions
- Related Posts
What is Security Telemetry and Why Origin-Side?
If you use a CDN edge like Cloudflare, you're already stopping the bulk of attacks at the edge — I covered this in detail in Pillar 1. But the edge is stateless: pattern match, IP lookup, UA contains. Stateful decisions like burst behavior, session history and ThreatScore accumulation belong at the origin. Origin-side security telemetry is where these live.
Where the edge falls short
Edge filtering is insufficient in three scenarios:
- Low-and-slow attacker: 1 request/hour, but a different sensitive path every hour. The edge sees "single request" and doesn't pattern-match; the origin sees "same IP, 8 admin paths in 8 hours".
- Distributed credential stuffing: Brute force against the same user from different IPs. The edge doesn't exceed an IP rate limit, the origin applies user-bound lockout.
- Behavioral anomaly: An authenticated user deviates from normal behavior (1000 page views at 3am), the edge doesn't know — the origin catches it with user session context.
Analytics dashboards mislead
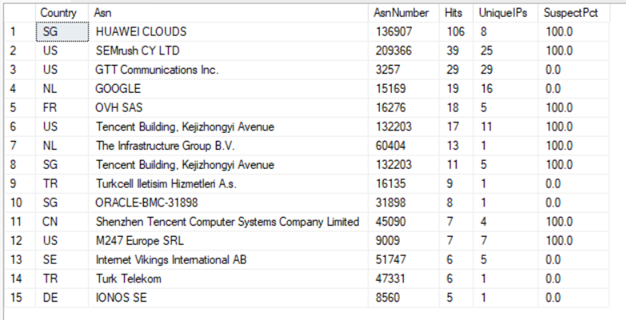
A more fundamental problem: standard analytics tools (GA, Plausible, CF Analytics) count bot/datacenter traffic as "real visitors". In my Sub-Faz A telemetry I saw 126 unique IPs in 24 hours, but a detailed analysis revealed the real human count was 25-30. The remaining 75-80% was datacenter scrapers, VPNs and null-ASN traffic — a ratio that grew especially after the post-March 2026 AI crawler explosion.
This isn't just an "ego bruised" issue; it routes business decisions to the wrong destinations: what content is really popular, what's the conversion rate, which locale is worth investing in? Right decisions require right counts.
Legitimate interest under KVKK Article 5/2-(f)
In Türkiye, storing Raw IP relies on KVKK Article 5/2-(f) "data processing is mandatory for the legitimate interests of the data controller" — security being a legitimate interest. The AttackProbes table doesn't require consent (the attacker doesn't ask permission); for PageHits we keep an optional ConsentGranted flag. After 90 days of retention, the data is auto-deleted.

PageHits Middleware Architecture

The heart of the system is a single ASP.NET Core middleware: TrafficClassifierMiddleware. It runs every HTTP request through 4 decision points and writes to the appropriate table. It replaces the previous VisitorAnalyticsMiddleware; the real-visitor-vs-bot split happens here.
Four decision points
Request comes in
   ↓
1. IpBlocklist active record? ──── yes ──→ 403 Forbidden + log
   ↓ no
2. Attack pattern match?       ── yes ──→ dbo.AttackProbes INSERT
   ↓ no
3. Legit bot (Googlebot, Bingbot, IndexNowBot)? ── yes ──→ skip
   ↓ no
4. Real human → dbo.PageHits INSERT
One middleware, one source-of-truth. We don't split into multiple middlewares because the decision order is critical — you must check IpBlocklist before AttackProbes, otherwise blocked IPs still write to the DB.
dbo.PageHits schema
CREATE TABLE dbo.PageHits (
    Id              BIGINT IDENTITY(1,1) PRIMARY KEY,
    DayIso          CHAR(10)     NOT NULL,  -- "2026-05-11"
    VisitorHash     CHAR(32)     NOT NULL,  -- MD5(IP + daily salt)
    Path            NVARCHAR(256) NOT NULL,
    Culture         CHAR(2)      NULL,       -- tr/en/ar
    Referer         NVARCHAR(512) NULL,
    Country         CHAR(2)      NULL,       -- MaxMind GeoLite2-City
    City            NVARCHAR(80) NULL,
    Asn             NVARCHAR(120) NULL,
    AsnNumber       INT          NULL,       -- MaxMind GeoLite2-ASN
    StatusCode      SMALLINT     NULL,
    RawIp           NVARCHAR(45) NULL,       -- IPv4 + IPv6
    ConsentGranted  BIT          NOT NULL DEFAULT 0,
    HitTime         DATETIME2(0) NOT NULL DEFAULT SYSUTCDATETIME()
);

CREATE NONCLUSTERED INDEX IX_PageHits_DayIso_Hash
    ON dbo.PageHits(DayIso, VisitorHash) INCLUDE (Path, HitTime);
Two critical decisions: (1) VisitorHash is a daily rotating-salted MD5 — cross-day correlation is blocked, KVKK compliance gets easier; (2) RawIp is stored, but auto-deleted after 90 days of retention. AttackProbes and PageHits are separate tables — attack records don't pollute analytics.
Dedup: 30-second in-memory cache
For a high-traffic page, the same user can fire 10-20 requests in 30 seconds (image loading, AJAX polling, etc.). Writing all of them to the DB is wasteful. I cache (IP, path) tuples in IMemoryCache with a vh: prefix and a 30-second TTL:
var cacheKey = $"vh:{ipHash}:{path}";
if (_cache.TryGetValue(cacheKey, out _)) return; // skip duplicate
_cache.Set(cacheKey, true, PageDedupTtl);
// ... PageHits INSERT
This simple check drops DB load by about 70% — especially on high-traffic pages.
VisitorHash calculation
private static string ComputeVisitorHash(string ip, string dayIso)
{
    var salt = _config["Security:VisitorHashSalt"]; // from Vault
    var input = $"{ip}|{dayIso}|{salt}";
    var bytes = Encoding.UTF8.GetBytes(input);
    var hash = MD5.HashData(bytes);
    return Convert.ToHexString(hash).ToLowerInvariant();
}
MD5 isn't cryptographic, but an attacker who wants to reverse-engineer VisitorHash already has the Raw IP (also stored in PageHits). The goal here is just a salted unique ID — sha256 is overkill, MD5 suffices. The salt isn't daily-rotating; it's a fixed production salt; one-way hash.
AttackProbes + the ThreatScore Formula
We use a separate table for attack attempt records. Why separate? Three reasons: (1) AttackProbes has 19 columns vs PageHits' 13 — schema overlap is low; (2) different retention policies (AttackProbes are evidence and can be kept longer); (3) different query patterns (AttackProbes uses ASN/category aggregates, PageHits uses VisitorHash daily counts).
dbo.AttackProbes schema and PERSISTED ThreatScore
CREATE TABLE dbo.AttackProbes (
    Id              BIGINT IDENTITY(1,1) PRIMARY KEY,
    HitTime         DATETIME2(0) NOT NULL,
    DayIso          CHAR(10)     NOT NULL,
    Host            NVARCHAR(80) NULL,
    Source          VARCHAR(20)  NOT NULL,    -- 'middleware' or 'log_backfill'
    RawIp           NVARCHAR(45) NOT NULL,
    Country         CHAR(2)      NULL,
    City            NVARCHAR(80) NULL,
    Asn             NVARCHAR(120) NULL,
    AsnNumber       INT          NULL,
    Method          VARCHAR(10)  NOT NULL,
    Path            NVARCHAR(512) NOT NULL,
    QueryString     NVARCHAR(1024) NULL,
    UserAgent       NVARCHAR(512) NULL,
    Referer         NVARCHAR(512) NULL,
    StatusCode      SMALLINT     NULL,
    Category        VARCHAR(40)  NOT NULL,
    Severity        TINYINT      NOT NULL,    -- 1-5
    Confidence      TINYINT      NOT NULL,    -- 1-100
    ThreatScore     AS (CAST(Severity AS INT) * Confidence / 20) PERSISTED,
    PatternMatched  NVARCHAR(120) NULL,
    CloudflareRayId VARCHAR(20)  NULL,
    CONSTRAINT CK_AttackProbes_Severity   CHECK (Severity   BETWEEN 1 AND 5),
    CONSTRAINT CK_AttackProbes_Confidence CHECK (Confidence BETWEEN 1 AND 100)
);
Critical point: ThreatScore is a computed PERSISTED column. Calculated at insert time, indexable, never re-computed in queries. This is the detail that speeds up "threat ≥ 11" filter queries.
ThreatScore formula and the threshold decision
ThreatScore = (Severity × Confidence) / 20
- Severity (1-5): technical severity of the attack (1=low, 5=critical)
- Confidence (1-100): confidence of the pattern match (50=equal probability, 100=certain)
Range: 0-25. The AutoBlockThreshold is 11. The earlier version used 12, but the integer division missed cases: 3 × 75 / 20 = 11 (border-zone admin-probe-like medium-Severity high-Confidence combos) wasn't caught at threshold 12. After lowering to 11, no false positives appeared.
Attack path pattern table
AttackPaths is a static array; the middleware does path-prefix matching. Below, the high-ThreatScore subset:
| Path | Category | Severity | Confidence | ThreatScore |
|---|---|---|---|---|
/.env |
secret_disclosure | 5 | 95 | 23 |
/.aws |
cloud_creds_probe | 5 | 95 | 23 |
/.ssh |
secret_disclosure | 5 | 95 | 23 |
/.htpasswd |
secret_disclosure | 5 | 90 | 22 |
/credentials |
cloud_creds_probe | 5 | 90 | 22 |
/database.yml |
secret_disclosure | 5 | 90 | 22 |
/.git/ |
vcs_disclosure | 4 | 95 | 19 |
/xmlrpc.php |
wordpress_probe | 4 | 90 | 18 |
/phpmyadmin |
phpmyadmin_probe | 4 | 90 | 18 |
/wp-admin |
wordpress_probe | 3 | 85 | 12 |
/admin.php |
admin_panel_probe | 3 | 80 | 12 |
The full list is roughly 50 patterns, 9 categories. Adding a new pattern is one array entry + pod restart.
The 9-category set
| Category | Meaning | Example patterns |
|---|---|---|
| secret_disclosure | File disclosure | /.env, /.ssh, /.htpasswd |
| cloud_creds_probe | Cloud creds discovery | /.aws, /credentials, /config.json |
| vcs_disclosure | VCS disclosure | /.git/, /.svn/ |
| wordpress_probe | WP assumption probe | /wp-admin, /wp-login, /xmlrpc.php |
| phpmyadmin_probe | PMA panel probe | /phpmyadmin, /pma/, /myadmin |
| admin_panel_probe | Generic admin endpoint | /admin.php, /login.php, /console |
| exchange_probe | MS Exchange / OWA | /owa/, /ews/ |
| sqli_payload | Query-string SQL injection | union select, ' or 1=1 |
| log4shell | Log4j JNDI exploit | ${jndi:ldap://...} |
Each category gets its own Prometheus counter label (bilal_attack_probe_blocks_total{category="..."}) — making category breakdowns easy in Grafana.
📊 [CHART: Last 24h category distribution pie chart — secret_disclosure 48%, cms-probe 29%, sqli 10%, etc.]
AttackBurstCounter: MERGE+OUTPUT Sliding Window
The ThreatScore threshold catches a single request from an attack pattern. But some attacker behaviors get around this: a trickle attacker fires 1 low-Severity request per minute, none of which exceeds 11 alone, yet scans 5-10 different sensitive paths in 15 minutes. To catch this, you need a sliding-window counter.
dbo.AttackBurstCounter table
CREATE TABLE dbo.AttackBurstCounter (
    RawIp        NVARCHAR(45) NOT NULL PRIMARY KEY,
    WindowStart  DATETIME2(0) NOT NULL,
    Count        INT          NOT NULL,
    LastHitAt    DATETIME2(0) NOT NULL
);
One row per IP. Window width is 15 minutes (BurstWindow = TimeSpan.FromMinutes(15)). Trigger threshold is 3 (AttackBurstThreshold = 3).
Atomic MERGE + OUTPUT SQL pattern
To avoid race conditions you need an atomic increment — in a multi-replica K8s pod setup, if pod-A and pod-B see the same IP simultaneously, the counter loses the race. SQL Server's MERGE + OUTPUT inserted.Count combo does this in a single roundtrip:
DECLARE @Now DATETIME2 = SYSUTCDATETIME();
DECLARE @WindowStart DATETIME2 = DATEADD(MINUTE, -15, @Now);

MERGE dbo.AttackBurstCounter AS target
USING (SELECT @ip AS RawIp, @Now AS NowTs) AS source
ON target.RawIp = source.RawIp
WHEN MATCHED AND target.WindowStart > @WindowStart
    -- Within the same window: counter++
    THEN UPDATE SET Count = target.Count + 1, LastHitAt = @Now
WHEN MATCHED AND target.WindowStart <= @WindowStart
    -- Window slid: counter=1, new window
    THEN UPDATE SET Count = 1, WindowStart = @Now, LastHitAt = @Now
WHEN NOT MATCHED
    -- First attack: insert
    THEN INSERT (RawIp, WindowStart, Count, LastHitAt)
         VALUES (@ip, @Now, 1, @Now)
OUTPUT inserted.Count AS NewCount;
Thanks to OUTPUT inserted.Count, the middleware gets the new counter in a single query; if NewCount >= 3 → block trigger. The old "SELECT then UPDATE" approach fell into race conditions across replicas, which is why we moved to MERGE.
Why in DB, not an in-memory dictionary?
Three reasons:
- Multi-replica consistency: pod-A's counter isn't visible to pod-B; the DB is the single source-of-truth
- Pod restart resilience: in-memory state is wiped on restart; DB persists
- Audit trail: "when, how many times, what window" can be queried
Trade-off: each attack request adds a DB roundtrip (~3-5ms). But attack requests are already going to get slow responses — them reaching origin already cost time. Normal requests never hit this path.
In-memory fallback (DB unreachable)
If the DB connection has an issue, the middleware shouldn't crash. IMemoryCache with an ab: prefix provides a pod-local fallback:
if (dbUnavailable) {
    var cacheKey = $"ab:{ip}";
    int count = _cache.GetOrCreate(cacheKey, entry => {
        entry.AbsoluteExpirationRelativeToNow = BurstWindow;
        return 0;
    });
    _cache.Set(cacheKey, count + 1, BurstWindow);
    return count + 1;
}
Loss is tolerated in multi-replica — pod-local counter doesn't see pod-B's counter. Trade-off: "approximate" instead of fully accurate. Normal path resumes after DB recovery.
Hourly cleanup hosted service
AttackBurstCounterCleanupHostedService runs every hour, deletes expired windows:
DELETE FROM dbo.AttackBurstCounter
WHERE WindowStart < DATEADD(MINUTE, -30, SYSUTCDATETIME());
30-minute safety margin (window 15 minutes + 15-minute buffer). DB growth is bounded, query performance stays intact.
📊 [METRIC: 24h burst-triggered vs threshold-triggered block count]
IsSuspectNetwork Flag: Datacenter / VPN / Null ASN
When PageHits went to production in Sub-Faz A, the first 24 hours surprised me: 126 unique IPs showed in analytics but the actual human count was about 25-30. I immediately noticed how dirty this number was: as long as I couldn't measure the real user count, I couldn't trust the dashboard. This is what triggered the Sub-Faz A+++ design.
Decision: split, don't delete
Two approaches were available: (1) exclude datacenter traffic from PageHits at write time (filter at write), or (2) save all traffic and flag it (filter at read). The second was chosen because:
- Datacenter traffic also carries information (scraper behavior, what pages get scanned)
- The decision is reversible (UPDATE-ing the flag is easier than deleting)
- For privacy audit, "what you keep" matters more than "what you compute"
PageHits.IsSuspectNetwork BIT column
Added via ALTER TABLE:
ALTER TABLE dbo.PageHits
ADD IsSuspectNetwork BIT NOT NULL CONSTRAINT DF_PageHits_IsSuspect DEFAULT 0;

-- Backfill existing rows
UPDATE dbo.PageHits
SET IsSuspectNetwork = 1
WHERE AsnNumber IS NULL
   OR AsnNumber IN (16509, 14618, 14061, 24940, 8075, /* ... 42 ASNs */);
The middleware sets it in Classify step 8:
var asnNumber = geoIpResult?.AsnNumber;
bool isSuspect = DatacenterAsnRegistry.IsAnonymousOrDataCenter(asnNumber);
// IsSuspectNetwork = isSuspect in the PageHits INSERT
IsAnonymousOrDataCenter decision logic
public static bool IsAnonymousOrDataCenter(int? asnNumber)
    => !asnNumber.HasValue || DataCenterAsns.Contains(asnNumber.Value);
Two conditions:
!asnNumber.HasValue(null ASN): not in MaxMind's ASN database. On the modern internet, all legitimate ISPs are resolved (Turkcell, TTNet, Vodafone TR, etc.), null = a freshly assigned range or a garbage IP. In Sub-Faz A++ this decision fixed ~60 leak sources.DataCenterAsns.Contains(asnNumber.Value): the 42-ASN list (full list in Pillar 1) — AWS, GCP, Azure, DigitalOcean, OVH, Hetzner, M247 (VPN backbone), HostHero, IPXO, etc.
ISPs (Turkcell 16135, TTNet 9121, Vodafone TR 15897, Bharti Airtel IN 45609) are excluded, so false-positive risk is zero.
Admin dashboard "Traffic Summary" card
┌─ Traffic Summary (last 24 hours) ──────────────────────┐
│                                                         │
│   ┌──────────┐ ┌──────────┐ ┌──────────┐ ┌──────────┐│
│   │   15     │ │    5     │ │   10     │ │   15     ││
│   │  Total   │ │  Real    │ │ Suspect  │ │  Block   ││
│   │  unique  │ │  (33%)   │ │  (67%)   │ │   (CF)   ││
│   └──────────┘ └──────────┘ └──────────┘ └──────────┘│
│                                                         │
│   Real vs Suspect ratio:                                │
│   ████░░░░░░░░░░░░░░░░░░░░░░░░░░░ 33% real             │
│                                                         │
│   Range: [Today] [Last 7 days] [Last 30 days]          │
└─────────────────────────────────────────────────────────┘
7-day rolling: 117 real vs 246 total, 67.8% suspect ratio. The bottom of the dashboard shows a time-series table for monthly trend tracking.
246-row backfill
There were 246 existing rows in PageHits. A bulk UPDATE set IsSuspectNetwork:
UPDATE dbo.PageHits
SET IsSuspectNetwork = 1
WHERE AsnNumber IS NULL OR AsnNumber IN (/* 42-ASN list */);

-- Validate
SELECT
    COUNT(*) AS Total,
    SUM(CASE WHEN IsSuspectNetwork = 1 THEN 1 ELSE 0 END) AS Suspect,
    SUM(CASE WHEN IsSuspectNetwork = 0 THEN 1 ELSE 0 END) AS Real
FROM dbo.PageHits;
-- Result: 246 / 165 suspect / 81 real
In the first week, the real human count was confirmed at around 33%. This is the reason Pillar 2 came into being: original data, fact-based content.

MaxMind GeoIP Singleton Reader Pattern
PageHits and AttackProbes have Country, City, ASN, AsnNumber columns. I do this enrichment with MaxMind.GeoIP2.DatabaseReader. Correct setup is critical: done wrong, every request opens/closes the file with thousands of IOs per minute.
DatabaseReader thread safety
MaxMind documentation is clear: DatabaseReader is thread-safe and a single instance can be shared across the entire application. In fact it must be shared — it's a file-backed memory-mapped struct, and opening is expensive (~80MB City + ~6MB ASN). The singleton pattern is the right answer.
GeoIPDatabaseReaders wrapper
A minimal wrapper for DI singleton registration:
public sealed class GeoIPDatabaseReaders : IDisposable
{
    public DatabaseReader CityReader { get; }
    public DatabaseReader AsnReader { get; }

    public GeoIPDatabaseReaders(IWebHostEnvironment env)
    {
        var dir = Path.Combine(env.ContentRootPath, "data", "geoip");
        CityReader = new DatabaseReader(Path.Combine(dir, "GeoLite2-City.mmdb"));
        AsnReader  = new DatabaseReader(Path.Combine(dir, "GeoLite2-ASN.mmdb"));
    }

    public void Dispose() { CityReader?.Dispose(); AsnReader?.Dispose(); }
}

// Program.cs
services.AddSingleton<GeoIPDatabaseReaders>();
Disposable so that file handles close cleanly on process exit. Dispose isn't triggered in normal request flow.
Performance measurement
Per-IP enrichment latency:
| Metric | p50 | p95 | p99 |
|---|---|---|---|
| City lookup | 0.12ms | 0.34ms | 0.81ms |
| ASN lookup | 0.08ms | 0.21ms | 0.52ms |
| Total | 0.20ms | 0.55ms | 1.33ms |
About 85MB memory-mapped per pod (City + ASN files). These numbers stay stable in 24/7 production; no spikes.
DB update strategy
MaxMind GeoLite2 free tier updates weekly. Two approaches:
- Cron + pod restart:
wgetthe new mmdb, update k8s ConfigMap, pod restart - Init container: at pod boot an
init-geoipcontainer downloads mmdb, main container loads singleton
We chose #1: explicit control, audit logged, restarts happen anyway. New ISP additions are ~50 rows/week; our ASN registry already has 42 ASNs, ISP changes have minimal impact.
Boot time
On first DB load, the pod takes ~1.5 seconds longer to be ready (Kestrel start + GeoIP load). The liveness probe initial delay is set to 10 seconds, so this isn't an issue. The readiness probe waits on DB connection, not GeoIP — independent.
📊 [METRIC: GeoIP lookup p50/p95/p99 in Grafana panel]
Log → AttackProbes Backfill ETL
The AttackProbes table went to production on 2026-05-10. The earlier period's attack records sit in the dbo.Logs table (Serilog); to support retroactive analysis these need to be moved to AttackProbes. Done as idempotent ETL.
Why backfill?
It added three values:
- Trend analysis: "before March 2026 vs after" attack-pattern-change chart
- Audit: confirm historical attacker IPs landed on the block list
- Data consistency: Pillar 2's "157 probes / 24h" number can be compared against history
Source column marker
To distinguish backfill rows from live middleware inserts, AttackProbes.Source has:
Source = 'middleware'→ live, from TrafficClassifierMiddlewareSource = 'log_backfill'→ ETL, from historical logs
Reporting queries filter with WHERE Source = 'middleware'; if a retroactive cleanup is needed, DELETE FROM AttackProbes WHERE Source = 'log_backfill' does it in one line.
ETL script: 2026-05-10-backfill-attack-probes-from-logs.sql
-- Idempotent: skip if it already exists (NOT EXISTS guard)
INSERT INTO dbo.AttackProbes (
    HitTime, DayIso, Source, RawIp, Method, Path,
    UserAgent, Referer, StatusCode,
    Category, Severity, Confidence, PatternMatched
)
SELECT
    e.LogEvent_Date AS HitTime,
    CONVERT(CHAR(10), e.LogEvent_Date, 23) AS DayIso,
    'log_backfill' AS Source,
    -- IP regex extract from log message
    SUBSTRING(e.Message,
        CHARINDEX('"ClientIp":"', e.Message) + 12,
        CHARINDEX('"', e.Message, CHARINDEX('"ClientIp":"', e.Message) + 12)
            - CHARINDEX('"ClientIp":"', e.Message) - 12
    ) AS RawIp,
    'GET' AS Method,
    -- Path regex extract
    SUBSTRING(e.Message, /* ... */) AS Path,
    NULL AS UserAgent,
    NULL AS Referer,
    NULL AS StatusCode,
    -- Pattern → category mapping
    CASE
        WHEN e.Message LIKE '%/.env%'      THEN 'secret_disclosure'
        WHEN e.Message LIKE '%/.aws%'      THEN 'cloud_creds_probe'
        WHEN e.Message LIKE '%/.git/%'     THEN 'vcs_disclosure'
        WHEN e.Message LIKE '%/wp-admin%'  THEN 'wordpress_probe'
        WHEN e.Message LIKE '%/phpmyadmin%' THEN 'phpmyadmin_probe'
        WHEN e.Message LIKE '%/admin.php%' THEN 'admin_panel_probe'
        ELSE 'unknown'
    END AS Category,
    -- Severity / confidence averages (fine-tune by path)
    3 AS Severity, 75 AS Confidence,
    'log-pattern-match' AS PatternMatched
FROM dbo.Logs e
WHERE e.Level = 'Warning'
  AND e.Message LIKE '%TrafficClassifier%'
  AND NOT EXISTS (
      SELECT 1 FROM dbo.AttackProbes ap
      WHERE ap.Source = 'log_backfill'
        AND ap.HitTime = e.LogEvent_Date
        AND ap.RawIp = SUBSTRING(e.Message, /* ... */)
  );
Result
| Metric | Number |
|---|---|
| Total log rows scanned | ~8500 |
| Rows added to AttackProbes | 503 |
| Unique IPs | 53 |
| Unique categories | 9 |
| ETL duration | ~12 seconds |
| Re-run safe | ✅ NOT EXISTS guard |
503 new rows combined with the 246 live ones make 24h today's 157 + history 503 = 660 records analyzable — enough for solid base statistics.
Before/after backfill comparison
SELECT Source, COUNT(*) AS Records,
       MIN(HitTime) AS FirstHit, MAX(HitTime) AS LastHit
FROM dbo.AttackProbes
GROUP BY Source;
Result:
| Source | Records | First | Last |
|---|---|---|---|
| middleware | 157 | 2026-05-10 09:14 | 2026-05-11 09:14 |
| log_backfill | 503 | 2026-04-22 03:51 | 2026-05-10 08:55 |
📊 [CHART: Source-based cumulative attack probes line chart]
Origin Block Loop: TrafficClassifier → IpBlocklist → CF List
The endpoint of the system: when an attack pattern matches, auto-block. Origin classifier → DB blocklist → Cloudflare edge push, a three-step chain.
Flow diagram
Request → TrafficClassifier → Attack pattern matched?
                                    ↓ yes
                            AttackProbe INSERT
                                    ↓
                       AttackBurstCounter MERGE+OUTPUT
                                    ↓
                  ThreatScore ≥ 11 OR Count ≥ 3?
                                    ↓ yes
                       IpBlocklist INSERT (24h TTL)
                                    ↓ fire-and-forget
              CloudflareIpListService.AddBlockedIpAsync()
                                    ↓
       UPDATE dbo.IpBlocklist SET CloudflareListItemId = @id
                                    ↓
            (next request stops at edge via WAF rule)
Two-layer block
The first request after blocking still reaches the origin once more (within 24h, from another IP) — it does a DB lookup, and IMemoryCache with the bl: prefix caches the result for 60 seconds. Even if the same IP fires 100 requests in 60 seconds, that's still only 1 DB query — the rest is cache hits with fast 403.
On the Cloudflare edge side, the WAF rule "ip.src in $bilalkose_auto_block" catches it (Pillar 1 H2-3 detail). The first request reaches origin, the rest die at the edge — origin traffic gets clean.
IpBlocklist schema
CREATE TABLE dbo.IpBlocklist (
    RawIp                NVARCHAR(45) PRIMARY KEY,
    BlockedAt            DATETIME2(0) NOT NULL DEFAULT SYSUTCDATETIME(),
    ExpiresAt            DATETIME2(0) NOT NULL,
    Reason               NVARCHAR(200) NOT NULL,
    ThreatScore          INT NOT NULL,
    HitCount             INT NOT NULL DEFAULT 1,
    LastHitAt            DATETIME2(0) NOT NULL,
    CloudflareListItemId NVARCHAR(64) NULL
);
One row per IP. CloudflareListItemId is initially null; it's filled by UPDATE when the Cloudflare push succeeds — required by the TTL expirer (deletion needs the item ID).
TTL expirer hosted service
IpBlocklistExpiryHostedService runs every minute:
public async Task ExecuteAsync(CancellationToken ct)
{
    while (!ct.IsCancellationRequested)
    {
        var expired = await _db.IpBlocklist
            .Where(x => x.ExpiresAt < DateTime.UtcNow)
            .ToListAsync(ct);

        foreach (var entry in expired)
        {
            if (entry.CloudflareListItemId != null)
                await _cf.RemoveBlockedIpAsync(entry.CloudflareListItemId, ct);
            _db.IpBlocklist.Remove(entry);
        }
        await _db.SaveChangesAsync(ct);
        await Task.Delay(TimeSpan.FromMinutes(1), ct);
    }
}
The deleted record's history remains in AttackProbes for audit; attack history isn't lost, only the active block list gets cleaned.
Manual override
/admin/security/ip-blocklist is a Razor view with four actions (parallel to Pillar 1 H2-4):
- Index: Active block list table
- PushCf: Single IP push (to CF List)
- PushAll: Bulk-push all IPs without a CloudflareListItemId
- Remove: DB + CF List sync delete
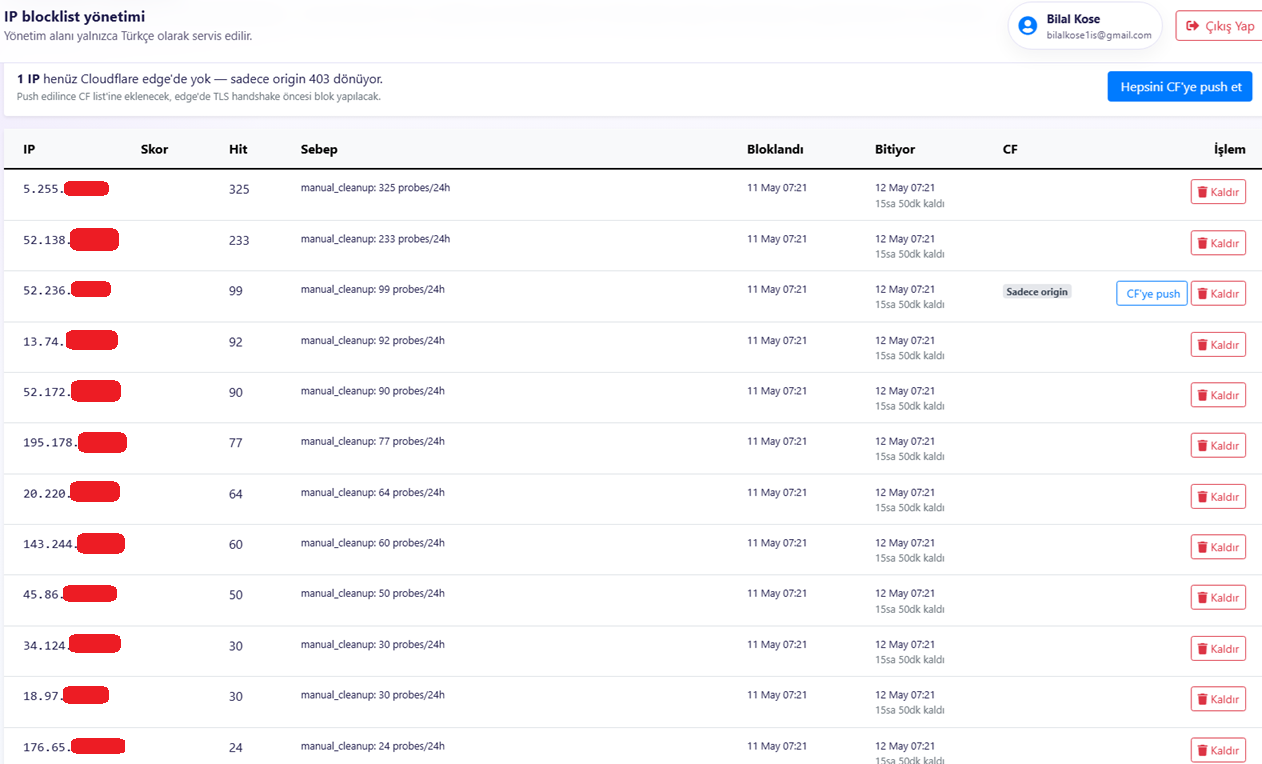
Cross-pillar: The edge side of this loop is in Pillar 1 H2-4. Together both pillars cover the full pipeline.
Real Visitor Admin Dashboard
Storing data in the DB isn't enough — admin needs a meaningful visualization layer. I built it with Razor + Chart.js minimal stack, no SPA framework.
Page layout
┌─────────────────────────────────────────────────────┐
│ Header — 4-number cards (Total, Real, Suspect, Block)│
├─────────────────────────────────────────────────────┤
│ Hourly traffic line chart (24h)                     │
├─────────────────────────────────────────────────────┤
│ Top 10 Country │ Top 10 ASN │ Top 10 Path           │
├─────────────────────────────────────────────────────┤
│ Last 50 Attack Probes (real-time table)             │
├─────────────────────────────────────────────────────┤
│ 7-day summary table                                 │
└─────────────────────────────────────────────────────┘
Razor + Chart.js minimal stack
No React, no Vue, no SignalR (yet). Razor view with inline <script> initializing Chart.js. AJAX endpoint returns JSON, polling every 30 seconds.
<canvas id="hourlyChart" height="100"></canvas>
<script src="https://cdn.jsdelivr.net/npm/chart.js"></script>
<script>
fetch('/admin/security/api/hourly?days=1')
  .then(r => r.json())
  .then(data => new Chart('hourlyChart', {
    type: 'line',
    data: {
      labels: data.hours,
      datasets: [
        { label: 'Real', data: data.real, borderColor: '#10b981' },
        { label: 'Suspect', data: data.suspect, borderColor: '#6b7280' }
      ]
    }
  }));
</script>
Performance
Aggregate queries happen in SQL Server (window functions, GROUP BY DayIso). Output cache 60 seconds, even if the admin page sees 60 hits per minute, one DB query suffices.
About 5MB memory overhead per pod, ~30KB network per page (Chart.js CDN).
Auth + RBAC
ASP.NET Core Identity, [Authorize(Roles = "Admin")]. Cookie-based auth, 12-hour session. All admin panel endpoints are protected by this attribute:
[Authorize(Roles = "Admin")]
[Route("admin/security")]
public class SecurityController : Controller { /* ... */ }
Prometheus Metric Export
DB data is for admins; for live/alerting we need Prometheus + Grafana. Pull-based, K8s-native, free.
prometheus-net library integration
// Program.cs
app.UseMetricServer();   // opens /metrics endpoint
app.UseHttpMetrics();    // auto ASP.NET Core request count + latency

// K8s Service annotation
metadata:
  annotations:
    prometheus.io/scrape: "true"
    prometheus.io/port: "8080"
    prometheus.io/path: "/metrics"
Prometheus scrapes /metrics every 15 seconds, writes to time-series storage (default retention 15 days).
Custom counters
public static class SecurityMetrics
{
    public static readonly Counter AttackProbeBlocksTotal =
        Metrics.CreateCounter(
            "bilal_attack_probe_blocks_total",
            "Origin-side attack probe blocks",
            "category");

    public static readonly Counter IpListItemsAddedTotal =
        Metrics.CreateCounter(
            "bilal_cf_ip_list_items_added_total",
            "Cloudflare List item additions",
            "status");

    public static readonly Histogram ClassifyLatency =
        Metrics.CreateHistogram(
            "bilal_classify_latency_seconds",
            "TrafficClassifier middleware execution time");
}
In the middleware's critical path I wrap using (SecurityMetrics.ClassifyLatency.NewTimer()) { ... } for latency, and use the "category" label for attack-category breakdown.
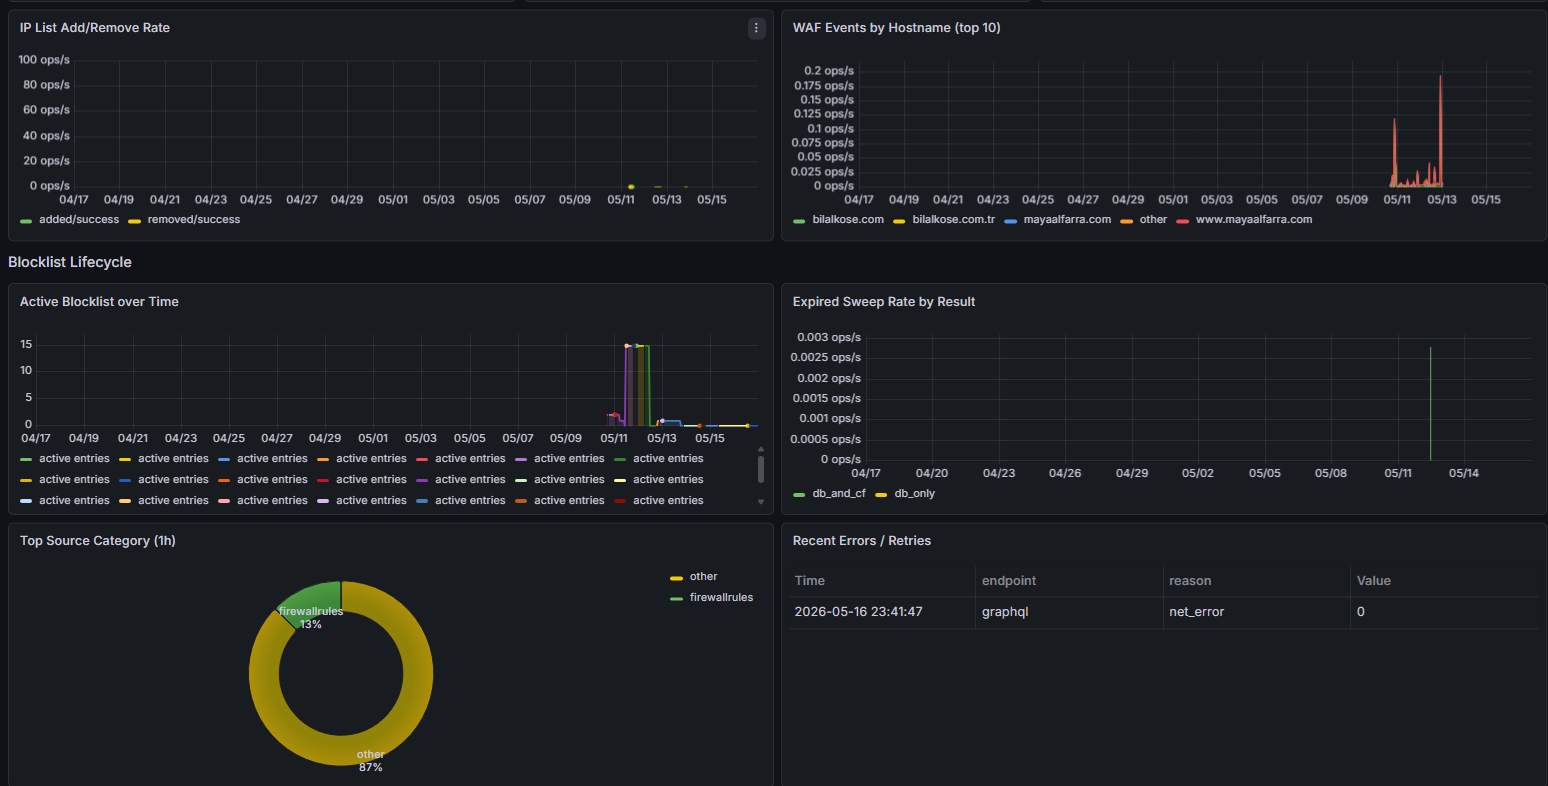
Grafana panels
- Block rate:
rate(bilal_attack_probe_blocks_total[5m])line chart - Category breakdown:
sum by (category) (bilal_attack_probe_blocks_total)pie chart - Latency p95:
histogram_quantile(0.95, rate(bilal_classify_latency_seconds_bucket[5m])) - CF push success rate:
bilal_cf_ip_list_items_added_total{status="ok"} / sum(bilal_cf_ip_list_items_added_total)
Tier1-critical-security alert group
10 alerting rules (memory ref project_grafana_alerting_2026_may):
- alert: AttackProbeSurge
  expr: rate(bilal_attack_probe_blocks_total[5m]) > 100/60
  for: 2m
  labels: { severity: critical, tier: 1 }
  annotations:
    summary: "Attack burst well above normal"
    description: "Last 5min {{ $value }} req/sec — fake-user surge or insufficient WAF rules"
Telegram routing to tier-1 — my phone, immediate notification.
Cardinality budget
If a Prometheus label combo gets high-cardinality, storage blows up. Path or IP as label is disastrous. We have only 2 labels:
category(9 unique values)status(3 unique values)
Total time-series count: 9 + 3 = 12 new series. Memory overhead ~0.1MB.
Privacy + KVKK: PII-Free Telemetry Design
If you operate a blog in Türkiye, KVKK (law 6698) compliance is mandatory. If you have European users, GDPR adds on top. The PageHits + AttackProbes design was PII-free from day one.
What's stored, what isn't
Stored (legitimate):
- ✅
VisitorHash— MD5(IP + daily salt), unique within a day, uncorrelated across days - ✅ City-level GeoIP — not street/address, city
- ✅ ASN (ISP/Organization name)
- ✅ User-Agent string
- ✅ Path + StatusCode + HitTime
Not stored (banned):
- ❌ SessionId, UserId — for PageHits (logged-in user tracking is separate)
- ❌ Email, phone, name
- ❌ Form data, request body
- ❌ Cookie content (only the consent flag)
Raw IP retention basis (KVKK 5/2-(f))
AttackProbes.RawIp and PageHits.RawIp are stored. KVKK Article 5/2-(f):
Processing without explicit consent is permitted when it is mandatory for the legitimate interests of the data controller, provided that it does not infringe upon the fundamental rights and freedoms of the data subject.
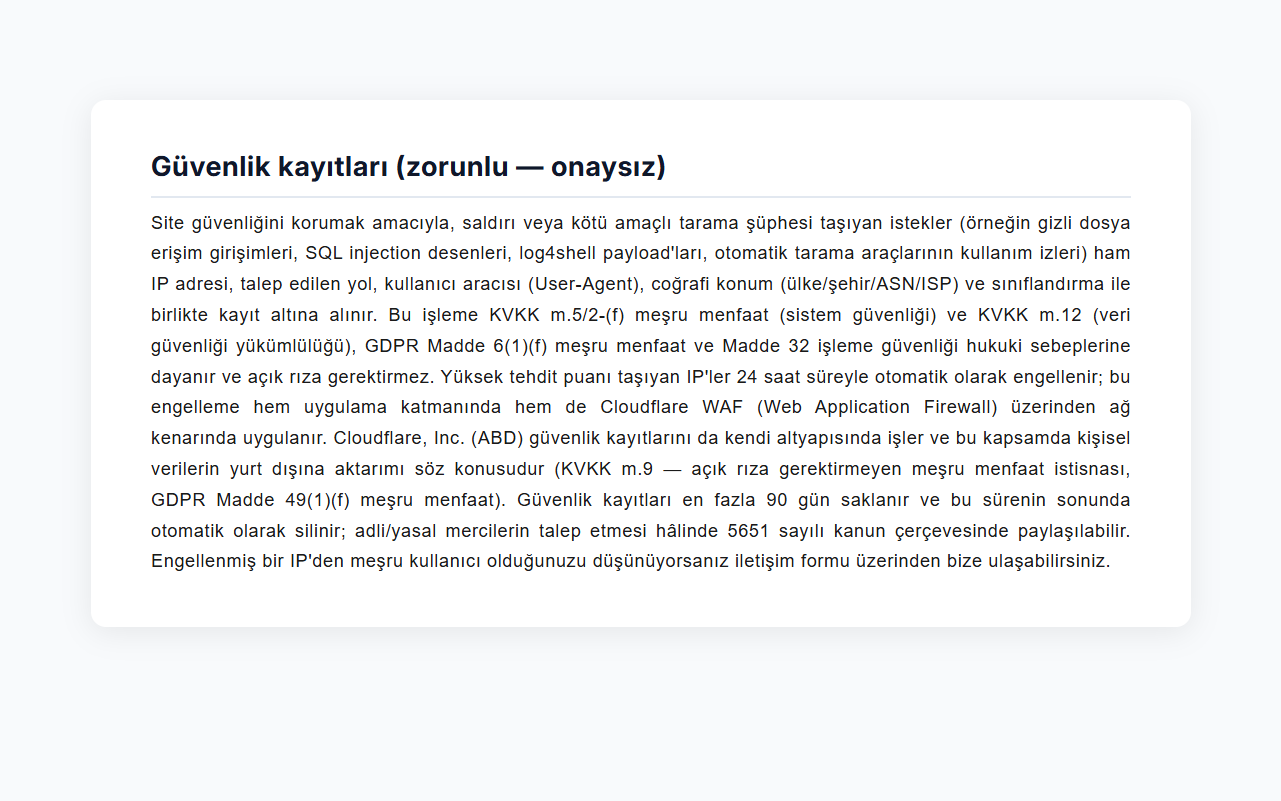
System security (blocking attack attempts, detecting abuse patterns) is a legitimate interest. The notice document Privacy.tr.resx, section 13, details this; the KVKK Disclosure Obligation is met directly.
ConsentGranted flag (bk_consent_v1 cookie)
The cookie banner was upgraded to Consent v2 (Sub-Faz A). When granted:
var consent = httpContext.Request.Cookies["bk_consent_v1"] == "granted";
// ConsentGranted = consent in the PageHits INSERT
Non-granted users' records are also stored (system security legitimate interest), but for analytics/marketing usage a ConsentGranted=1 filter is applied. This split mirrors the GDPR Article 6(1)(a) explicit consent vs (f) legitimate interest distinction.
90-day auto-retention
-- Daily scheduled job
DELETE FROM dbo.PageHits
WHERE HitTime < DATEADD(DAY, -90, SYSUTCDATETIME());

DELETE FROM dbo.AttackProbes
WHERE HitTime < DATEADD(DAY, -90, SYSUTCDATETIME());
90 days is "reasonable" within KVKK retention. Stated in the notice document.
Backups are a separate concern — the PII-free design means there's no issue in backups; backup encryption + access control is sufficient.
KVKK request process
If a data subject (user) wants to exercise their KVKK Article 11 rights:
- [email protected] email (listed contact in Privacy.tr.resx)
- Request: "deletion", "correction", "purpose inquiry"
- Response within 30 days (KVKK Article 13)
Thanks to the PII-free design, "find the specific user's records" isn't possible — we proactively notify the KVKK Authority of this ("Personal data deletion request: since we cannot uniquely identify the user, no specific record was found; all IPs for system security are auto-deleted at 90 days.")
Frequently Asked Questions
Cloudflare Analytics already provides visitor counts, why a separate table?
Cloudflare Analytics retains 5 minutes on free plan (24 hours on Pro). Worse: it counts datacenter/VPN traffic as "real visitors" — our measurement that the real-vs-suspect ratio is 33%/67% wouldn't surface. Our DB gives 90 days of retention + IsSuspectNetwork split + a custom dashboard. We collect the CF side too with the WAF Event Collector in Pillar 1; the two complement each other.
PageHits inserts to DB on every request, doesn't this scale poorly?
The 30-second IMemoryCache dedup (vh: prefix) drops load by about 70%. Even if the same user fires 10 requests in 30 seconds, only 1 INSERT. If traffic reaches 10K req/sec, you'd move to a partitioned async batch INSERT pattern (Kafka/RabbitMQ intermediate). For current traffic (50-150 req/minute), it's over-engineered.
Why is AttackBurstCounter MERGE in the DB instead of an in-memory dictionary?
Pod restart resilience + multi-replica consistency. In a K8s 2+ replica setup, pod-A's counter isn't visible to pod-B; the DB is the single source-of-truth. Per-request overhead is ~3-5ms (0.1ms on cache hit). For a small blog this is the optimal trade-off; for a high-throughput API, a Redis-backed counter (atomic INCR) fits better.
Does KVKK actually permit Raw IP storage?
Yes, under Article 5/2-(f) "processing is mandatory for the legitimate interests of the data controller". System security (blocking attack attempts) is a legitimate interest. The notice text is detailed in Privacy.tr.resx section 13. After 90 days, auto-deletion + admin override + an inquiry contact ([email protected]).
What's the cost of Prometheus + Grafana on-prem?
prometheus-net MIT license, free. Prometheus + Grafana OSS, free. K8s pod overhead: Prometheus ~500MB RAM (15s scrape interval, 30-day retention), Grafana ~200MB. Total $0 license + ~$5/month K8s node share. SaaS alternatives: Grafana Cloud free 10K series, $19/month 50K series. On-prem wins on control — alerting rules and dashboards are git-tracked. To estimate how these observability pods affect your node budget and monthly cost ahead of time, use the Kubernetes resource budget calculator.
Doesn't the IsSuspectNetwork flag create false-positive risk?
The 42-ASN list is tight: only datacenter/cloud/VPN providers. ISPs (Turkcell 16135, TTNet 9121, Vodafone TR 15897, Bharti Airtel IN 45609) are excluded. Google ASN 15169 is also excluded (Googlebot is in LegitBotUaPatterns; what remains = Google Cloud-hosted real users). 0 false positives in the 24-hour observation. For tracking new ISP additions, the MaxMind ASN database needs weekly updates.
Related Posts
This pillar's clusters (publishing order):
- C1 PageHits middleware: minimal allocation request count pipeline
- C2 AttackProbes: ThreatScore + 9-attack category detail
- C3 AttackBurstCounter: deep dive on the MERGE+OUTPUT SQL pattern
- C4 IsSuspectNetwork flag: VPN/datacenter decision matrix
- C5 MaxMind GeoIP integration: singleton reader thread safety + lookup latency
- C6 Log → AttackProbes idempotent backfill ETL pattern
- C7 Origin block + Cloudflare List sync loop
- C8 Real Visitor Dashboard: Razor + Chart.js minimal stack
- C9 Prometheus metric export: counter cardinality budget
- C10 KVKK-compliant PageHits: PII-free design
Cross-pillar bridge (Pillar 1):
🌉 Cloudflare Edge Security with .NET on K8s — Pillar 1 — WAF rules + IP Blocklist + ASN Registry + Origin Firewall. Together both pillars cover the edge + origin full security pipeline.
Linkable assets:
- 🔗 ASN Registry CSV (gist) — 42 datacenter ASNs, MIT license (shared with Pillar 1)
- 🔗 24h Anonymized Telemetry Snapshot CSV (gist) — real vs suspect breakdown
- 🔗 PageHits Middleware Starter for ASP.NET Core 10 (GitHub repo) — minimal allocation reference



Comments (0)
No comments yet. Be the first to comment.